The Law Of Small Numbers By Joseph Buchdahl
The law of small numbers is a cognitive bias where people show a tendency to believe that a relatively small number of observations will closely reflect the general population. Read on to test your logical powers with the hospital quiz and find out how graphs can be misleading and what you can do to avoid losses when using stats to place your bets.
The Hospital Quiz
In 1974 two psychologists, Daniel Kahneman and Amos Tversky, presented their experimental subjects with the following scenario, accompanied by a question. A certain town is served by two hospitals. In the larger hospital about 45 babies are born each day and in the smaller hospital about 15 babies are born each day.
As we know, about 50% of all babies are boys. However, the exact percentage varies from day to day. Sometimes it may be higher than 50%, sometimes lower. For a period of one year, each hospital recorded the days on which more than 60% of the babies born were boys. Which hospital do you think recorded more such days?
The larger hospital
The smaller hospital
About the same (within 5% of each other)
According to binomial theory, the number of days where boys born outnumber girls by at least six to four will be nearly three times greater in the smaller hospital compared to the larger one, simply on account of the larger volatility in birth ratios. A larger sample is less likely to stray very far from 50%. Yet only 22% of respondents gave the correct answer.
What are heuristics?
Kahneman and Tversky described this error as a belief in the law of small numbers. More generally, judgements made from small samples are often inappropriately perceived to be representative of the wider population. For example, a small sample, which appears randomly distributed, would reinforce the belief that the wider population from which the sample is selected will also be randomly distributed.
Conversely, a small sample demonstrating an apparently meaningful pattern – such as nine heads from 10 coin tosses – will cause the observer to believe that the population will display the same meaningful pattern. In this case the assumption would be that the coin is biased. The experience of perceiving patterns in random or meaningless data is called apophenia.
A belief in the law of small numbers is part of a wider group of mental short cuts that people take when making judgements under uncertainty. Kahneman and Tversky called these short cuts heuristics. Making generalisations from small samples is an example of a representativeness heuristic, where people assess the probability of a particular event based solely on the generalisation of previous similar events that comes easily to mind.
Another example of the representativeness heuristic is the expression of the gambler’s fallacy. Indeed, such a bias arises out of the belief in the law of small numbers. As Kahneman and Tversky say:
The heart of the gambler's fallacy is a misconception of the fairness of the laws of chance. The gambler feels that the fairness of the coin entitles him to expect that any deviation in one direction will soon be cancelled by a corresponding deviation in the other. Subjects act as if every segment of the random sequence must reflect the true proportion; if the sequence has strayed from the population proportion, a corrective bias in the other direction is expected.
Reading graphs of unequal sample sizes
Sports bettors can be particularly prone to faulty pattern recognition through a misplaced belief in the law of small numbers. Misinterpreting profitability from small samples of wagers as representative of a departure from randomness and evidence of predictive skill can have unpleasant financial consequences over the longer term. Consider the hypothetical profitability chart of 100 wagers on NFL point spreads below. Each bet is struck at a price of 1.95. Impressive, isn’t it?
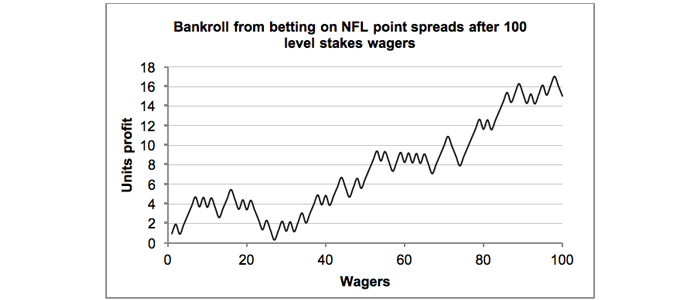
What if I told you this record comes from a well-known US sports handicapper? With a decent growth trend and a yield of 15% you might be forgiven for believing me. Of course, I’m lying. In fact, the next chart of 1,000 wagers reveals the bigger picture.
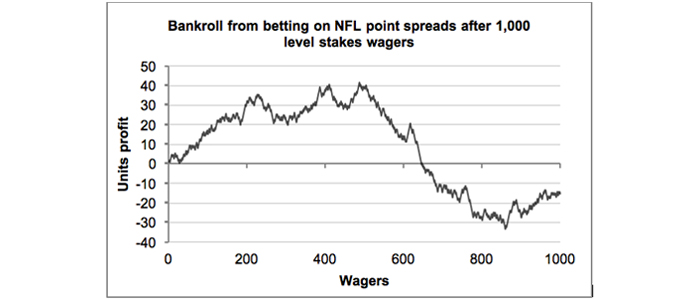
Really there was no long term profitability to be had at all. The reason: this was merely produced by a random number generator which assumed a 50% chance of an individual win and a profit expectation of -2.5%. The first chart simply represents the initial 100 wagers of the second.
Yet even in the second longer time series a healthy profitability was maintained for several hundred wagers. Furthermore, despite showing an overall loss, the pattern of the time series looks anything but random, with a fairly consistent wave-like pattern to it.
However, as Kahneman and Tversky recognised, we are far more likely to perceive sequences of similar outcomes as being non-random even if there is no underlying mechanism behind them. Of the two binary sequences below, which looks random and which not?
0, 0, 0, 0 1, 1, 1, 1, 0, 0, 1, 1, 0, 0, 1, 1, 1, 1, 1, 1
0, 1, 1, 0, 1, 0, 0, 0, 1, 1, 0, 0, 1, 0, 1, 0, 0, 1, 1, 1
The majority of people would pick the second sequence. In fact, the first was generated randomly in Excel and I made up the second purposely with shorter sequences of 1s and 0s. When asked to create random sequences like this many of us will switch from 1 to 0 or vice versa if we feel that one of them is happening too often.
Now take a look at the following 1,000-wager charts. They were all randomly generated. The large range of possible outcomes should provide you with a flavour of just how easy it is to be fooled by apparently meaningful patterns.
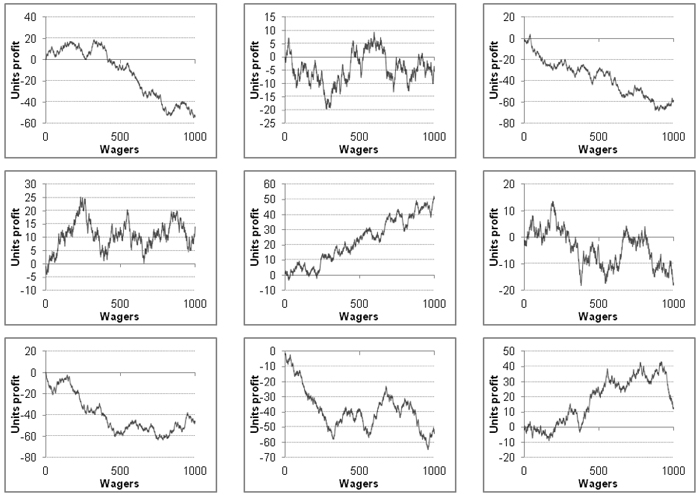
Remember, these are not series of 100 wagers, but 1,000. Take a look at the middle one. It has all the hallmarks of an expert tipster or bettor with a 5% yield and solid profit growth throughout the entire sequence of betting, the sort of performance the best handicappers are capable of long term. And yet it happened just by chance.
Using the binomial distribution we can work out the probability of still being in profit after a period of betting despite having an expectation of -2.5%.
Number of Wagers (odds 1.95, 50% win probability) / Minimum number of wins needed / Probability of being in profit
100 52 38.22%
250 129 32.90%
500 257 28.05%
1000 513 21.46%
2500 1283 9.68%
5000 2565 3.40%
10000 5129 0.51%
After 1,000 wagers we still have over a 1-in-5 chance of being in the black despite our betting being nothing more than random. If we placed one handicap bet on every NFL game played, this would take us nearly four seasons. That’s a long time to believe we have anything other than luck on our side.
How small is small?
The law of small numbers is a cognitive bias where people show a tendency to believe that a relatively small number of observations will closely reflect the general population. Furthermore, as this exercise has shown, small can sometimes be quite large. It exists because people favour certainty over doubt, explanation over ignorance, causation over association, patterns over randomness and skill (particularly self-serving skill) over chance. For sports bettors, failure to truly appreciate its significance can be costly.


No comments:
Post a Comment