Sunday 29 July 2018

Favourites, Football and Fantasy

There was a subsequent 'clarification' Tweet from RJ Bell this morning on the subject of 'big' favourites in the MLB and 'big' favourites in the NFL, although RJ has now changed 'big' to 'biggest':

Unfortunately the comparison is still false, because as I explained in my earlier post, the biggest favourites in MLB have around an 80% win probability, nowhere near the 95% win probability of the biggest NFL favourites.
There are no PW = 0.95 in baseball - we all know -1500s will win more than -400s. Doesn’t mean they are more profitable.
-400 favourites should win approximately 80% of the time. -1500 favourites should win approximately 93.75% of the time. Essentially getting excited over the fact that 93.75 is greater than 80 isn't helpful. Yes, we all understand that there will be more winners at evens than at 2/1 than at 3/1 than at 4/1 and so on - it's how probability (usually) works.

I say 'usually' because there's one mathematical genius claiming the ability to consistently find 2.8 winners 60% of the time out there. He blocked me, which is easier to do than provide a logical reason why this freak of probability might make any sense, but Jason gets his nonsense, calling our friend out on his 'mumbo-jumbo', his lack of understanding about independent events, the 'cost of doing business', what an equity curve is, and just basic probability really. It should shock me that so many people think that using big words can give someone an edge, but I've been here a while and there are a lot of gullible people out there lacking the ability to see through bullshit. 


Small Road 'Dogs
Back to our 'favourite' subject, and big favourites do also lose in the NFL - since 1989, there have only been fifteen teams favoured by 17 or 17.5 points, and three of those lost, but as RJ might well point out at some point, the "biggest" favourites - those giving 18 points or more - haven't, at least not yet, with a 17-0 record in the 29 seasons from 1989. Seventeen selections is a small sample size, and the value is actually with the underdog on these lines, with a 12-5 record against the spread.

It's a little early to be talking about American Football but it's getting close. The College season opens on August 25th and the NFL on September 6th.

Readers will no doubt be all over the College Small Road 'Dogs strategy which has been profitable in all but two seasons this millennium, with very small losses in those two losing seasons (see left). The number of bets averages a very manageable 94 a season, with the busiest weekend of 2017 at 11 bets.

The 2017 season had 92 bets and went 53-37-2 ending with an ROI of 14.1%. The long-term ROI on 1,600 bets is 7.24%
Something to keep an eye on, if you are so inclined, is the fortune of the Big Road 'Dogs which have turned around in the past couple of seasons after years of futility. Most College Football matches have Big Road 'Dogs so there can be a lot of selections. The ROI in each of the past two seasons is 3.6%, but 887 selections isn't practical.

This weekend I completed a list of strategies for the EFL and National Leagues, the criteria requested being an ROI of at least 10% and profitable in each of the last three seasons. With 48 matches per round, it was important to make sure that the number of bets is practical. I included this one after much debate:
+94.72 points from 536 selections, ROI 17.7%
It's a great ROI%, but is close to four selections each round in that division.

And on the subject of football, Betty Blogger asked me to send interested Fantasy Football people his way. It's not my thing, but he's running a Fantasy Mini league and paying the winner £100 sterling, which seems very generous. 

And finally, I am on another work trip for the next week and a half, which is terrible timing as I shall be away for my month-end spreadsheet update, and miss the start of the new football season.  

Barring a disaster, the spreadsheet will be up for the 27th month out of the last 29 which is quite incredible, and one of those losses was a small one of double digits which just made it all the more irritating. When the loss is five figures, it's out of my hands, when it is less than £100, it's not.  

Bell Sounds Off

The biggest upset in MLB in 14 years last night, as the Kansas City Royals defeated the New York Yankees who were a -410 favourite in US odds.

This equates to 1.2439 in decimal odds, so an implied losing probability of 19.6% coming to fruition isn't usually exactly earth shattering, but the nature of baseball means that this was only the tenth -400 or shorter selection since 2004.

RJ Bell, a name covered in this blog on a couple of occasions back in 2016 took to Twitter to make a highly dubious comparison with the NFL:

At -410, this was indeed the biggest favourite to lose in the MLB since 2004, although it should be noted that this loss was only 13 days after the Houston Astros lost as -400 favourites versus the Detroit Tigers. July can be a tricky month with the All-Star game disrupting routines as I've mentioned before.

But the attempted comparison with NFL favourites at -15 or more is a strange one. There really is no comparison. I replied:
The nature of the sport (MLB) means that it is very rare to find a team with a win probability greater than 0.8. With 2,430 regular season games per season, and not even including the post season, 15 bets out of 35,545 plus opportunities is less than 0.0004.  

NFL games where a team is favoured by 15 points or more? 48 from 'just' 4,005 games, i.e 0.012, or approximately 28 times as frequent. 

As for the -15 handicap being considered equivalent to -400 on the Money Line, I have the -8.5 handicap as closer. Teams at -15 win around 95% of the time, not around 80%.   

Wednesday 25 July 2018

Finn Pickings

By special request, here's a look at the Draw in Finland's Veikkausliiga. I can't say Finland's ever been a league that has interested me, with its teams with strange names (usually just initials), and the only traditionally named club (Tampere United), at least by English standards, a major part of the match fixing scandal there of 2008-2011. 

I think I've seem just one Finnish team play live - Lahden Reipas at West Ham United in the Cup Winners Cup 1975. I probably still have the programme somewhere, and of course, Finn Aki Riihilahti was lucky enough to play for Crystal Palace but anyway, Helsinki based Frenchman Frederic J, a man with whom I appear to have a lot in common based on his timeline, and who thus seems like a decent and intelligent chap, wrote or rather Tweeted:

Recently found it? Well, better late than never I guess. Indeed the data is available, as always courtesy of Joseph Buchdahl's Football Data web site, with the price data supplied by Pinnacle.

My first observation was a general one regarding the over-round. After averaging 102.5% in the six seasons 2012 to 2017, it has edged up this season to 103.2%, not a negligible increase and something to be aware of if this league is of a betting interest to you. 

Blindly backing the Draw in the 1,308 matches with prices since 2012 would have lost you 2.2% and the best 'blind' strategy here is laying Away teams, with an ROI of 3.4%

Backing all home teams priced at greater than 3.0 would have generated an ROI of over 21%, and backing all Away teams when the Home team is 1.5 or shorter has an ROI of over 34%.

For the Draw, the market appears to be inefficient when the implied probability is in the 28% to 30% range, or 3.35 to 3.57.  A 14% ROI here from 384 bets, or back the Draw when the Away team is odds-on for an ROI of 24%, but only 113 selections over the six and a half seasons. 

The local derby factor is alive and well in Finland though - for games between teams based in and around Helsinki the 27 matches since 2012 have generated 18.73 points in profit, an ROI of 69%

Sunday 22 July 2018

Really Close, Close And The Difference

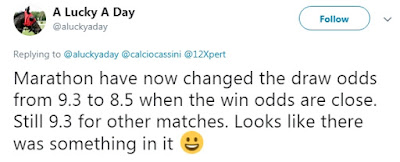
I almost got a speeding ticket today. After seeing the below Tweet from A Lucky A Day, I spun my car around and raced home to open an account with Marathonbet:

Of course, all was not what it seemed, and a request for clarification revealed that the reference was actually not to draw odds, but to the odds on a 'tie' in gold 2 ball betting, a bet I haven't paid much attention to. I was under the impression that these bets were usually TNB, as in tie no bet, but apparently some books offer the tie.

Such a move would increase the over-round by a full percentage point, so I'm not sure whether the move has been balanced by improved prices on the individuals.

Unlike the golf 2 ball bet, the Draw in football, when the two teams are close, is something I do pay attention to. My reviews of the Draw in various leagues over the summer, looking at the six completed seasons from 2012-18, made frequent references to the 'differences' between teams. In fact, my current 
all-time most popular post looked at this topic in some detail back in January 2018, while a follow up post on the topic was published in June, and included this:
I mentioned in the January post the idea of calculating the difference between the teams by simply using the odds (Pinnacle's Closing Prices), and using that as your selection criteria.

For example, in matches where the teams win probabilities are close, i.e. the difference is less than 25%, backing the Draw is +78.91 points from 393 matches which is an ROI of 20.1%.
Note that these probabilities are after I have removed Pinnacle's over-round to come up with the 'true' probabilities for each outcome.

The definition of 'close' is subjective, but in the English Premier League, most matches are not close. More than half (51%) of matches see one team with a win probability 60% or higher than their opponent. 73% of these are a Big 6 v Little 14 match, and are best avoided from a Draw backing perspective.

For 'really close' EPL games, again subjectively those where the difference is less than 5%, Pinnacle's Draw price ranged from 2.92 to 3.75, two numbers which are most definitely not close.

Overall the ROIs at this level are great for the Draw, 32.3% for all matches, and 36% for Little 14 matches, but when a price of over 3.5 is available, the ROI is 180%. That is not a typo, although you'll need patience as these opportunities are few and far between with just nine qualifiers in six seasons. 

What you can do is set up your spreadsheet to adjust your stake for such opportunities, as rare as they might be.

Incidentally, the Championship has more such 'really close' matches (28) and the ROI for Draws offered at this seemingly generous level is 40%.

Saturday 21 July 2018

Reds See Red, Officially

At least one reader has proved me wrong this week on my assertion that 99% of readers simply do not have the discipline to follow some of the strategies outlined here.

Fizzer was all over my MLB strategy of following favourites in their first game back after the All-Star break, although this year was 'officially' a losing one on both the Money Line and Run Line. As mentioned in 2016:
One trend that did hold true again this season was that of favourites doing well in their first games after the break. The rationale for this is that although the better teams are likely to be better represented at the All-Star game, many of those will only put in a less than exhausting cameo performance, while the majority of their players enjoy the break and get some rest which apparently benefits better teams more than worse teams.

These once a year trends are of limited value of course - come next year and 99% of people reading this will have forgotten about it.
At least 1,034 people have read that post, so my 99% estimate should perhaps be 99.9%.

As for the 'officially' reference, I say this because both Fizzer and myself had basically the same outcome this year, which was of a small profit. 

'Officially' the Reds at -110 were the selection at home to the Pirates, but at the time I placed my bets, the Pirates were favourites at -105. 

As I've written before, sometimes these market moves work out for you, and sometimes they don't. Fizzer delved deeper and found that:
Reds opened as favourites, it flip flopped but Reds were favs again at 10:00am but after that Pirates became clear favs.)
Looks like the prices they used, checking some other games, were taken about 10:00am Eastern, so 10 hours before the game.
Yesterday the market turbulence worked out in our favour, with Fizzer writing that while the 'official' record...:
Shows a 2 point loss on the 15 games... my own records showed I made a small 0.3 points profit.
Officially then, the loss was 2.06 points this year, but since 2004 this has been a solid strategy with a close to 20% ROI, so the spreadsheet reminder for 2019 is in place. 
There will always be games like the Reds - Pirates yesterday, where teams qualify at one time in the day, but not at others. Don't worry about it.

Fizzer finished up with this line:
I’m also a big advocate of the EPL draws method you reviewed again this year. Been using that for some time now.
Good to hear. Although the trend is towards fewer Draws (in the first five seasons of the Premier League, 29% of matches ended as Draws, whereas the latest five saw this decrease to just 24.26%), eliminating consistent losers and applying a disciplined approach means that profits can be made for little effort.  

Thursday 19 July 2018

William Hill

My recent post Draws On The International Stage caught the attention of at least one reader, specifically this sentence here:

William Hill went just 2.7 for the Draw, in a book that was over-round by 112.8%.
The email I received came as something of a surprise:
Good day,

Hope you are well. It’s xxxxxx from William Hill.

First of all, I’d like to thank you for mentioning my company in your post Draws On The International Stage. It means a lot!

I noticed that you hadn’t included details of our brand and was wondering if you would be kind to include a link pointing to our website William Hill, so your visitors would see more information about your reference.

Thanks again for the mention and have a great day!
I suspect that the writer either hadn't read the post, or perhaps hadn't understood that the sentence, while honest (as are all my posts), wan't perhaps the most flattering to the company. I responded, of course: 
Hi xxxxxx –
Thank you for your email – it’s good to know that someone is out there reading my thoughts and comments about sports investing. It can get lonely at times.

My mention of William Hill in the recent post Draws On The International Stage was in connection to the 2006 World Cup Final (Italy v France) match odds market where your company went 2.5 Italy, 2.7 Draw and 2.8 France which works out at an over-round of 112.8%.
This didn’t compare well to Pinnacle’s over-round that day of 103.4% as they offered 2.54 Italy, 2.88 Draw and 3.41 France. Is this a reference you want to be highlighted?

Fortunately the markets are more competitive these days and I am pleased to see that for the 2018 World Cup Final, your company offered a much improved over-round of 104.8%, but this is still more than double that of Pinnacle’s 102.1% and still not as good a deal for punters as Pinnacle were 12 years ago.
And again, whatever selection was desired in the Final, the price was better value with Pinnacle – France were 2.2 compared to your 2.15, the Draw was 3.02 compared to your 3.0 and Croatia were 4.25 compared to your 4.0.
The William Hill over-round on the English Premier League last season also left a lot to be desired, averaging 104.9%. You did beat Ladbrokes who averaged an horrific 106.2%, but Bet365 came in at 103.1%, BetVictor were at 102.8% and Pinnacle at 102.1%.
So in regard to your request that I include a link to William Hill, and provide visitors with more information about my reference to your company, who would benefit from this?
My target audience is the more sophisticated bettor, who understands over-rounds, and the importance of getting the best prices possible when making an investment. These investors are thus also those who find their accounts quickly restricted or closed with ‘soft’ books such as William Hill and thus use Exchanges or ‘sharp’ books.
I’m sure you are aware that ‘soft’ bookmakers operate with high margins - as evidenced above -, and they do not welcome sports traders preferring to target mostly casual and unsophisticated punters and gamblers and encouraging them to use products such as Casinos, Poker, Bingo etc. which of course they can never win at over the long term.

‘Sharp’ bookmakers on the other hand, do not ban or restrict customers, operating on a lower margin, but benefiting from higher turnover. In my opinion, this is the way forward, and why I make frequent references to Pinnacle, using their prices as an achievable, but also often beatable, benchmark.

I’m confident that almost all visitors to my blog have heard of, and are capable of finding, William Hill on the Internet should they be looking for a ‘soft’ book, but have my doubts that this would be in either their interests or in yours.

I look forward to hearing your comments.
Perhaps it's not surprising that, to paraphrase (Arthur) Neville Chamberlain, I have to tell you now that no such response has been received. Should this situation change, I will of course provide an update. Should any readers be in need of a link to William Hill, please let me know and I will provide one.  

Tuesday 17 July 2018

After The Break

With the brief, but glamorous, World Cup now over and the more mundane MLB season enjoying its annual All-Star break, it's the perfect time to look at how the baseball strategies I've previously discussed are working out this season so far. It may not be as exciting, but with the MLB season running from early Spring to October, the number of opportunities make it potentially far more lucrative overall.

The profitability of backing shorties in MLB noted back in 2015 continues unabated. For the season to date, Money Line and Run Line combined are up 51.00 points in profit.

The Money Line is up 38.00 points, while the Run Line is up 13.00 points. It's interesting to note that the Money Line is the more profitable strategy before the All-Star Break, while the Run Line becomes the preferred option after the All-Star Break. 

From 2012, the Run Line prior to the break is +30.54 points, while after the break is +70.21. The Money Line shows a much smaller advantage before the break.

The Home Improvement strategy is also in profit again this season, Money Line and Run Line combining for 37.23 points in total: 
Historically, this strategy is only profitable after the All-Star Break, but last season it was profitable every single month.

The third and final strategy readers might be following, although I highly doubt it, is the deliciously named T-Bone strategy, but this method is one that sizzles before the All-Star Break rather than after. 

From 2007 to 2017, 76.5% of profits were in the first part of the season.
As previously explained, all returns are calculated using the US method of risking the line to win one unit when playing favourites and risking one unit to win the line when playing dogs.

Monday 16 July 2018

England, Erskine And Southgate

My old friend Ian Erskine is on his soap box again, offering his views on the World Cup in general and on England's World Cup.

Despite all the hype surrounding England's performance, my thoughts on Twitter, somewhat tongue in cheek were that:

As is often the case, England started this tournament slowly, needing a stoppage time goal to get past Tunisia in a match England were 1.5 to win. The win at 1.23 over Panama was as comfortable as they come, and then there was the almost meaningless match against Belgium in which a loss guaranteed an easier bracket. 

Ian commented that "the Belgium game (only team England played ranked above them and priced shorter than them) was a non-match". To be clear, while Belgium were a shorter price than England to win the World Cup overall, England were clear favourites to beat Belgium in the final group game. Pinnacle's prices were England 2.43, Draw 2.85, Belgium 3.86, the result highlighting the challenges with betting on games where motivation is a factor.

After narrowly getting past a James-less Colombia in the Round of 16, a game we were 2.15 to win in 90 minutes) and arguably getting the "can't win on penalties" monkey off our back might well be the best positive from this tournament, we played a dull, efficient, dare I say boring, German-like performance against Sweden (1.85 to win in 90) to reach the Semi-Final, where we were outplayed by an individually talented, but very average Croatia side. England were 2.33 to win in 90 minutes here.

Is Southgate the manager for England moving forward? I can't see the FA dumping him after what most people view as a successful World Cup, and personally would like to see him given another tournament, but I'm admittedly biased on this given his Crystal Palace links.

However, Ian's assertion that regarding Southgate - "Problem is, he is tactically naive and not a f****** winner" needs to be corrected.

The man has a solid record of being a winner - who can forget Crystal Palace's Championship winning season of 1993-94 with Southgate as captain?

He also, far less importantly I admit, won the League Cup with both Aston Villa and Middlesbrough, and played in an FA Cup Final and a UEFA Cup Final.

He also played for England in the summer tournaments of 1996, 1998 and 2000 although most people will unfortunately remember him for his decisive penalty miss in the 1996 Semi-Final.

Finally, Ian strangely fails to mention Southgate's co-written book "Woody & Nord: A Football Friendship" which won the Sports Book of the Year award for 2004 from the National Sporting Club (now the British Sports Book Awards).

Not a f****** winner!  

Draws On The International Stage

A low-scoring third-place play-off and a high scoring final match were not what was expected based on history, but for those who understand the value of the Draw in knock-out games, World Cup 2018 was another success.

The 'official' profit from the fifteen matches using Pinnacle prices where available was 1.61 points, an ROI of 10.7%, which is completely meaningless given the small sample size of any one individual tournament, but we have now had five World Cups this millennium, a sample size of 75 matches, and the total profit from this strategy is 22.35 points, an ROI of close to 30%.

Only one World Cup, South Africa 2010, showed a loss (-1.99 points), and only one round (the Semi-Finals) shows an overall, but small, loss. With matches never overlapping, the number of consecutive losses is useful to know, and is just four. 

Fortunately, with next next World Cup four years and four months away, the success of a Draw backing strategy in international tournaments isn't just limited to the World Cup.

Euros from 2000 have an ROI of 19.4%, Copa America tournaments from 2007 (I have no price data for prior tournaments) have an ROI of 12.8%, and the three Confederation Cup tournaments from 2009 (again, no price data before that) have an ROI of 56%

Overall, these four tournaments combined have a basic ROI of 22%, 36.52 points from 167 matches, but as other studies of the Draw in 'big' matches have shown, applying a simple filter improves these numbers still further. 

For example, ignore matches where one team has an implied probability greater than .667 and the ROI climbs to over 35%, with 50.12 points from 143 matches.

There are also some matches where the confidence in the edge is much higher - for example when the Draw is priced at 3.0 or shorter, the ROI is 55%. As the image above shows, the true price on the Draw from 2002-2018 was 2.68, but the lowest Draw price with Pinnacle in that time was 2.88 (and a winner too, I might add). William Hill went just 2.7 for the Draw, in a book that was over-round by 112.8%. 

Risking a conservative 4% of the bank on each bet, a 1,000 point bank would now be a 5,377.4 point bank. With the longest losing streak so far not exceeding five, a less conservative 10% stake of the bank (ratcheted) would now be worth 93,682 points, off a peak of 117,103.15 reached with the England v Croatia semi-final.  

It's worth noting that pre-Euro 2008, the over-round averaged 106% and so these returns should be easily beatable. For subsequent tournaments, the over-round is a more reasonable 102%.

Roll on Copa America 2019, by which time 99% of you will have completely forgotten about this post. 

Saturday 14 July 2018

England Rare Underdogs

Today's match is England's 69th in a World Cup Finals, the outcomes of the previous 68 being as follows:

For the first time in more than sixteen years, a run of 18 matches, England start a World Cup match as underdogs, a little piece of trivia pointed out by @MarkOHaire this morning. Here are the prices (using Pinnacle where available) from England's loss against Brazil in 2002 for Finals matches:
The England v Italy game of 2014 did see Italy as favourites on Betfair at 2.77, with England and the Draw both 2.95, but the average odds from 22 non-exchange bookmakers that day were England 2.5, Draw 3.0 and Italy 3.22.

The other surprise to readers might be the 2010 match against Germany, and here the Austrian based sports-book Interwetten and well known in Germany, had Germany and England joint favourites at 2.7 with the Draw at 2.9, a sure sign that even as late as 2010, local books adjusted for local biases. All other books had England as favourites that day, and had VAR been in place, we might well have won it!  

Friday 13 July 2018

Collovati Calamity

Just like that, it's not coming home after all, and England have a second match against Belgium in which neither country really cares who wins. Sure, there's an extra $2 million in prize money, but that's not likely to make a difference to how the match is played.

All but the inaugural World Cup has featured this third-place play off, while six Euros played this game before it was abandoned after 1980 when 18 penalties were needed to separate Czechoslovakia from Italy, and tournament organisers were beginning to get concerned that next day's final might have to be delayed.  At sometime around 3:27am, Fulvio Collovati's kick was saved, and the remaining crowd of 37 mostly friends and families of the players, trudged out into the shortest Neapolitan night of the year.

The 24 matches have an average number of goals of exactly 3.5, and consequently only four matches went to Extra-Time, with only the aforementioned 1980 game going to penalties. 10 of the last 12 third place matches saw goals for both teams. 

Since this game is not considered a knockout game, it's perhaps not surprising that the trends of fewer goals in recent seasons seen in knockout games is completely reversed in this oddity. The first 12 games averaged 3.25 goals per game, while the most recent 12 have seen an average of 3.75 goals per game.

Contrast these numbers with the Final match, which tends to be taken a little more seriously. Of 35 World Cup and Euro Finals, 13 went to Extra-Time, while four went to either a replay or penalties. Over half the matches were level at Half-Time, and the average goals per game was a more modest 2.74. 

From 1994, i.e. the last 12 Final matched, the average per game is 1.42 goals with seven games going to Extra-Time, and nine level at Half-Time. 13 of the last 17 losers failed to score. 

If you backed the Draw in the Semi-Finals you would again be in profit after a Half-Time Draw on Tuesday and a Full-Time Draw on Wednesday. 

No 0:0 scores at 90 minutes in this year's knockout rounds so far, the last time that happened in World Cups without second group stages was 1966, but plenty of 1:1s at an implied price of 2.8. 

Tuesday 10 July 2018

Adding In The Euros

As you were told in the last post, at least one quarter-final in every World Cup from 1986 has had at least one match go to penalties. I hope some of you cashed in. I suspected it might be the Sweden v England game, but in the end this was a rather dull game and an efficient German-like performance from England.

It had been 16 years since we last had a two goal lead in a knockout game but unfortunately, I am old enough to remember Leon 1970, so it was only at 90+4 that I felt totally relaxed.

Not such a big sample size of course, but from 1986 the 16 World Cup semi-finals have produced 11 Half-Time Draws and 5 Full-Time Draws, of which four went to penalties. 

With an all-UEFA line-up, it's not unreasonable to include Euro Semi-Finals for a larger sample, and of the last 11 combined tournaments which featured Semi-Finals, 19 matches have gone to Extra-Time, an implied price of 2.32 while 27 matches were Half-Time Draws, an implied price of 1.63. 

From 1990, 24 of the 28 matches were decided by one goal or Drawn after 90 minutes, but the four that were comfortable wins includes three of the last four matches played. 

Friday 6 July 2018

There's Always One (Penalty Shootout)

The Round of 16 ended up just about perfectly, although I would have happily lost my Draw bet on the final tie of the round to spare myself the emotional roller-coaster of Extra-Time and penalties, but as it turned out, lifting the penalty curse might prove to be a very important thing for England. They may need that confidence boost again very soon. 

Both of Tuesday's matches were 0:0 at Half-Time at prices of 2.46 and 2.56, and for the round, no less than seven of the eight matched were Half-Time Draws - three 1:1s and four 0:0s.

Here are the Full-Time Draw statistics for the World Cup. Noticeable that while the 1:1 score was the predominant Draw in earlier days, and has actually increased slightly in frequency, the 0:0 is now just as likely, resulting in the Draw probability now closer to 0.4 than the 0.2 of 1930 to 1982. 


So, eight teams left, two CONMEBOL v UEFA ties, followed by a pair of all-UEFA match-ups in a Quarter-Finals once again blessed by the presence of England. 

All eight have reached, and won at, this stage before, Russia as the Soviet Union in 1966. Four are former champions (Brazil, England, France and Uruguay), one is a previous finalist (Sweden), and the other three are all previous Semi-Finalists. Croatia finished third on their debut in 1998, tying Portugal's 1966 record, the Soviet Union finished fourth behind Portugal that year, while Belgium had a fourth place finish in 1986.

With 9 Quarter-Final appearances, England are third all-time behind Germany (14) and Brazil (13). The records of the other teams still standing are France (7), Russia, Sweden and Uruguay (5), Belgium (3) and Croatia (2).

From 1986, when Quarter-Finals were re-introduced after being dropped in 1974, 1978 and 1982, and the World Cup was devalued by that decision in my opinion, there have been 32 matches. 17 were Draws at Half-Time, 13 were Draws at Full-Time, and 11 went to penalties - at least one Quarter-Final shootout in each World Cup.

Of the 13 South America v Europe matches, 9 were Half-Time draws, 3 Full-Time Draws, and 3 went to penalties.

Of the 11 all-UEFA matches, no game saw more than one first-half goal, with 4 HT 0:0s,  4 finished as Draws, and all 4 went to penalties. 

Not surprising that one-sided matches are rare at this stage. Only three matches from 1986 have been decided by more than one goal, two all-UEFA matches (1998 Croatia 3 Germany 0, 2006 Italy 3 Ukraine 0), and one inter-confederation game in 2010 when Germany thrashed Argentina 4:0. Older readers might recall that those two used to be good teams.

The Half-Time 0:0 price on Brazil v Belgium is currently 3.0. I'm just sayin'.  

Tuesday 3 July 2018

World Cup Half-Time

21 goals in the six Round of 16 matches played so far, an average of 3.5 goals per game, means that 2018 is on track to beat the modern day record for this round of 24, (90 minutes only), set in 1994.

Some way short of the 40 goals at this stage in 1934, or 1938's 37 goals which included a 5:5 draw between Brazil and Poland, a walkover for Sweden, and two replays with Switzerland and Cuba needing a second game to get past Germany and Romania respectively, but more goals is not good for the Draw, as readers will know. 

Two more HT Draws yesterday mean 5 out of 6 winners so far, with two full-time Draws. While the Half-Time Draw can be odds-on, e.g. 1.91 for the Sweden v Switzerland game today, it can also be a lot higher. Yesterday I was matched at 2.42 on the Brazil v Mexico game and 2.58 on Belgium v Japan.

There have now been over 200 knockout games in the World Cup since its inception, and the Half-Time Draw numbers over the years, complete with the Draws broken out by score, are:

The Half-Time 0:0 in today's Sweden v Switzerland has traded at 2.56 (it's also traded at 1.61 which wasn't a good back), but looking at the implied price of the 0:0 in more recent years, anything close to 2.56 is good value. 

Note that in earlier years, and so far this year, the 1:1 was more frequent a Half-Time score than the 0:0, but since 1986 has been very much a rarer outcome. If the 2:2 is your preferred Half-Time Draw score, good luck. You'll need it.

Monday 2 July 2018

Slicing The World Cup Draw

Halfway through the Round of 16, and we got the Draws we were hoping for yesterday, From 1986, the Round of 16's 68 matched have now seen 22 Draws, an implied price of 3.09. 

Including all elimination games from that year, the 44 Draws from 124 matches make the implied Draw price 2.82. 

Our old friend Slicer has been touting the Draw on the Betfair Forum, posting the following:

I was walking through London's Hyde Park this morning enjoying the sunshine when I passed a park bench. An unshaven disheveled old man emerged from underneath layers of cardboard. He asked me for some spare change. I hesitated until he told me that his name was Martin Gale, the world renowned developer of the Martin Gale Successive Stakes betting method. He told me that if I gave him £2 for a cup of coffee, he would reveal to me a guaranteed progressive betting system for the rest of the World Cup. Looking at his appearance, I asked him if his methods were so successful why he was living like this. His reply that he had made so much money that it became meaningless and he wanted to go back to basics, living a simple life.

To cut the story short, he said that because there was really no outstanding team in the World Cup, and even the better fancied sides appear mediocre, draws can be expected, and that I had better get some sandwiches and shandies in to keep me going through many extra times and penalties. So I asked what was the bottom line. He said at the top level in most countries approx. 30% of games end in draws. So, he said, with 30 games left one might expect 10 games to result in draws, particularly as there is very little between most of the teams left in the competition.
He said start off with low steaks, back the draw in game 1-France v Argies. If you lose back the draw in game to establish the required prophet AND recover your lost steak on game 1. The system progresses like this to the end of the competition. With odds of approx. between 2/1 and 3/1, one can't lose too much and it will keep the interest.

Now- we have to decide if he was telling the truth about winning loads and going back to basics or whether his famed Martin Gale method has lead him to such losses that he is reduced to living in this manner.
I felt I had to tell the story of this meeting to you, my BetFair friends.
Make up your own mind as ever and good luck.
His friend is a little off with the claim that "at the top level in most countries approx. 30% of games end in draws" - how I wish that were true - but as history shows, Draws are a good bet in World Cup elimination games.

I'm also not sure where his friend got the '30 games left' from. There were 15 competitive games left at the start of the Round of 16, and now just 11.

I would also never encourage anyone to use anything but level stakes.  

Coincidentally, the Slicer post linked to above will take you back to June 2010 when the South Africa World Cup was in full swing, and it's a little sad that eight years later, I am still banging on about the Draw. The 0:0 hasn't come in yet, but there has been at least one such scoreline in every World Cup knock-out phase from 1986. I'll also mention that the implied price on the 0:0 Half-Time score in elimination games is 2.34, and 1.82 for the Half-Time Draw.  

Looking at today's games, can Mexico beat their famous "5th game" curse?
The Mexican national team have been eliminated from every FIFA World Cup at the round of 16 stage from 1994 onward, with the first incident happening in the 1994 FIFA World Cup when the team lost to Bulgaria through a penalty shootout, and since then were eliminated at the same stage from every tournament afterwards (losing to Germany in 1998, the United States in 2002, Argentina in 2006 and 2010, and the Netherlands in 2014).
Being group runner-up doesn't help their cause - Russia became only the second group runner-up to advance in three World Cups yesterday, so it's goodbye to the only two remaining non-UEFA or non-CONMEBOL nations later today.  

Sunday 1 July 2018

VAR In Perspective

Since the World Cup started, there's been a lot of talk about VAR increasing the number of penalties awarded. Betting Tools Brian proclaimed: 

There have been more penalties given this world cup than in the whole of the last one in 2014 and we haven’t yet finished the group stages.
No doubt the 59 penalties awarded in the first twelve games, or whatever the precise number was, had something to do with this idea, but the longer-term evidence doesn't suggest that this is the case at all. Recency effect anyone?

As for 'we haven't yet finished the group stages', this stage comprises 75% of the tournament in terms of matches. The knockout stage is just the icing on the cake, although it is very tasty icing.

The current total is actually 24, (average 0.48 per game), which is indeed the highest ever in a World Cup Finals surpassing 1990's 16, (average of 0.308 per game), but the sample size of one World Cup is small.

Two top leagues in Europe used VAR for the full 2017-18, while England's FA awarded the honour of being chosen for the first VAR match to Crystal Palace in their FA Cup Third Round match at Brighton and Hove Albion earlier this year.

In the Bundesliga last season, there were 88 penalties awarded, down from 97 in 2016-17 and up slightly from 84 in 2015-16. A three year average of 0.29 penalties per game.

In Serie A, there were 119 penalties awarded, down from both the 136 awarded in 2016-17 and the 121 in 2015-16, a three year average 0.33 per game.

Those seasons were for a combined 686 matches, so to jump to conclusions about penalties based on a few World Cup games is a little silly. I don't have the monthly numbers, so it is possible that both those leagues saw an early increase in penalties before teams adjusted and the averages were maintained, but were that the case, i think we would have noticed. 

The average number of penalties in the English Premier League over the past three seasons is a relatively low 0.24, very much in line with Betfair's average 4.05 price on this possibility: 

Last season's top penalty team was Crystal Palace, with most awarded (10) and most scored (8), a statistic that reflects the amount of time spent in opponent's penalty areas.