The 2018-19 NBA season starts tonight and I'll be following my strategy of 'when books go high, go higher' - to paraphrase Michelle Obama - as well as the Road Favourites System, results for which are below:


Note that the results above are not from backing ALL road favourites, although blindly backing these teams is profitable. The left hand part of the table is the basic system I use, the results on the right are from the 'premium' selections after an additional couple of filters are applied.
Not many bets from these, (although more last season than ever before), but a 20.8% ROI over 12 years is worth getting out of bed for. Individual results for the Premium selections for last season are to the left, although this was likely a one-off. And ignore the ridiculous ROI, which is meaningless from such a low number of selections.

There are 168 days with games during the regular season, and a higher total this season will not only reduce the number of selections, but hopefully increase the ROI percentage. Last season the optimal total for 100 bets or more was at the 225+ level, and this season I'll be backing Overs at a little higher than last season, up to a point. As with most markets, there's a limit to how far the value persists.
This would have generated 117 bets in 2015 and 130 last season and an ROI of 7.2%.
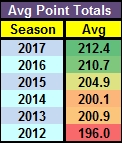
This strategy assumes that the average number of points per game will continue its climb. It certainly has room to go higher. As previously noted in this blog, the average during the last two months of the regular season was 214.6 points, which is about where I expect this season's average to end up.
The game has changed, as I've mentioned before. Since 2011, three-point attempts have increased by 61%, the number scored by the same percentage. That's a lot of extra points.
Field goals attempted are up 6%, field goals scored up by 5% and the 46% success rate last season was the highest since the days of Michael Jordan.
Free throws are down by two points, and the Free Throw / Field Goal ratio dropped below 2.0 last season for the first time ever.
Defensive rebounds are up, offensive rebounds are down (to be expected - it's hard to rebound if you're shooting from downtown).
Teams are also averaging six more possessions per game as the pace increases, but there's still room for more. In 1973-74, the first season that possessions per game were tracked, the average was almost 108. Last season was the highest since 1990-91, but still less than 100.
With change comes opportunity, and the NBA continues to evolve. If you can adapt before others, and American sports markets do seem to allow inefficiencies to continue for a longer time that should be the case, you can make some good profits. Good luck this season.


2 comments:
Not mentioning this year rule change is a bit weird for such article on NBA total going up.
Not mentioning this year rule change is a bit weird for such article on NBA total going up.
Post a Comment